Where Americans are moving comes down to a short list of forces: housing costs, job markets, retirement timing, and age. The states gaining people fastest are concentrated in the South and Mountain West. South Carolina grew 1.46 percent between July 2024 and July 2025, the fastest rate in the country, according to an analysis of Census Bureau data by SmartAsset. The states losing people — Vermont, Hawaii, West Virginia, New Mexico, and California — tend to sit at the top of national cost-of-living rankings.
The pattern is not one clean story, though. A separate dataset, U-Haul's 2026 Midyear Migration Trends report, shows the generations splitting. Boomers and Gen Xers favor warm, lower-cost Southeast destinations. Millennials and Gen Z still gravitate toward the biggest states and cities, including California and New York. The two datasets measure different things, but together they explain both the Sun Belt boom and its limits.
This is an explainer, not a forecast. Migration data describes what already happened. What it changes — congressional apportionment, state tax bases, housing demand — follows from the documented numbers below. For readers tracking how federal policy interacts with state-level shifts, the broader National News section follows those consequences as they land.
What do the official numbers actually say?
The Census Bureau's state estimates are the baseline. Per the SmartAsset analysis of Census data, the nation's fastest-growing states between July 1, 2024 and July 1, 2025 were South Carolina (+1.46 percent), Idaho (+1.44 percent), North Carolina (+1.32 percent), Texas (+1.25 percent), and Utah (+1.03 percent). Delaware, Washington, Arizona, Nevada, Tennessee, and Georgia rounded out the top tier, all near or above 0.88 percent.
Five states shrank in that window. Vermont fell 0.3 percent, the largest decline in the nation. Hawaii dropped 0.2 percent. West Virginia (-0.07 percent), New Mexico (-0.06 percent), and California (-0.02 percent) posted small losses. The slowest-growing states, including New York (+0.01 percent) and Illinois (+0.13 percent), cluster in the Northeast and Midwest.
One structural detail matters more than any single ranking. Per the same analysis, the South was the only region to record an increase in residents under 18 over the past five years, while the Northeast, Midwest, and West saw their share of young people fall. Growth in the South is partly retirements arriving and partly families staying or arriving with children.
Why is the Sun Belt growing so fast?
Cost is the cleanest explanation the data supports. The Missouri Economic Research and Information Center scores each state's cost of living from 0 to 100 across housing, groceries, utilities, transportation, and health. Hawaii topped that ranking with a score of 184.8, meaning its costs ran nearly 85 percent above the national average in early 2026, driven by housing. California ranked third, Alaska fifth, and New York sixth — all states with negative or near-zero growth.
Housing prices tell the same story from the demand side. Per Redfin data cited in the analysis, the median sale price of a Vermont home was $423,674 in June, slightly above the national median of $408,776. California's median sat at $777,566. A household priced out of a coastal market finds the same salary goes further in Columbia, Boise, or Dallas.
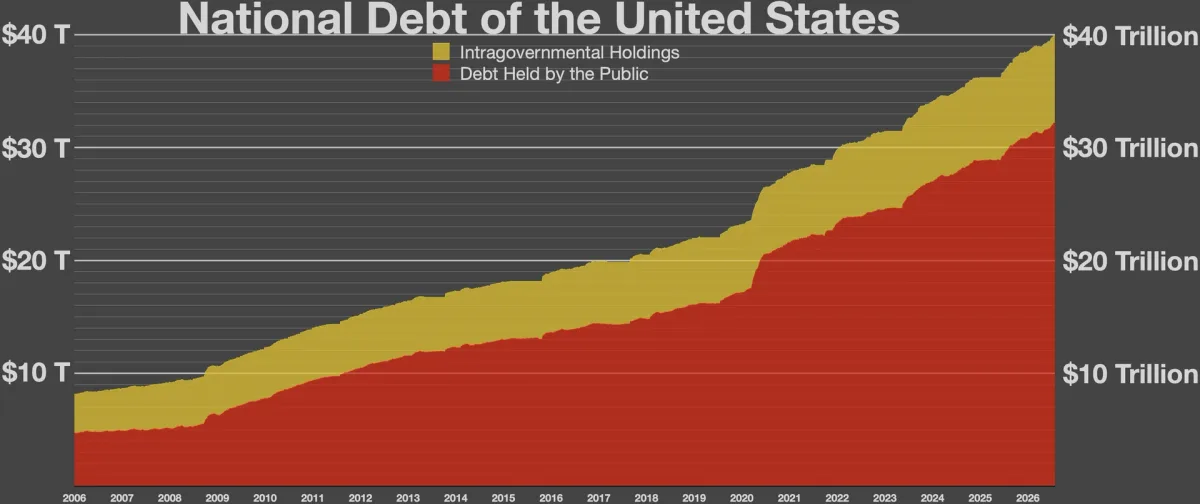
Jobs matter too, and the two datasets converge on it. U-Haul attributed millennials' gains in Ohio, Indiana, Minnesota, and Wisconsin to career moves. Where job growth and cheap housing overlap — Texas, the Carolinas, Idaho — growth compounds. Readers following the fiscal side of these shifts, from infrastructure spending to who ultimately holds federal obligations, can see the money mechanics in our piece on who owns the national debt. Readers following this should also see Who Owns the National Debt: What Is the National Debt and Who Owns It?.
Where are Americans moving by generation?
The generational split is the most useful finding in the U-Haul data. The company's 2026 Midyear Migration Trends report, released July 29, analyzes 52 weeks of one-way truck, trailer, and U-Box moves from July 2025 through June 2026, ranked by each state's net gain. As Fortune reported, the rankings split cleanly along age lines.
- Boomers picked the Carolinas: South Carolina first, North Carolina second, Florida third. Nearly every metro on their list is in the Sun Belt, led by Gainesville-Ocala, Florida, and Myrtle Beach, South Carolina.
- Gen X put Florida first, Texas second. Their top metros — Fort Myers, Charleston, Sarasota, Miami — are all in Florida, South Carolina, Arizona, and Tennessee.
- Millennials ranked Florida and Texas above California, but they also showed up in the Midwest, with Ohio, Idaho, Indiana, Minnesota, and Wisconsin in their top 10. Their top metros were Dallas–Fort Worth, Houston, and Orlando, with the San Francisco Bay Area as a notable outlier.
- Gen Z chose Texas first and California second, followed by New York. New York City was their top metro, with Chicago, Denver, and Seattle in the top 10.
Florida was the only state to make the top 10 for all four generations. Texas made every list except the boomers'. The youngest movers are heading to the expensive big cities the aggregate data says people are leaving — a reminder that "where are Americans moving" has no single answer, only answers by age and budget.
How reliable is moving-truck data, really?
It is a snapshot, not a census, and the limits are worth stating plainly. U-Haul is not the only moving company, and many households relocate without renting a truck at all. The company itself notes that each move is assigned to the generation of whoever signs the rental contract, so the sizable Gen X gains in college towns like Gainesville and Madison, Wisconsin likely reflect parents moving kids to school. Renters must be 18 for a truck, so the youngest Gen Z members are invisible in the data.
Still, U-Haul handles millions of one-way moves a year, which makes the direction of its rankings meaningful. Millennials and Gen X together account for more than 60 percent of its rentals. Read alongside the Census-based state estimates, the two sources agree on the big picture: net movement toward the South and Mountain West, with the biggest exceptions among young adults.
What does this change for the states losing people?
The documented consequences run in two directions. The aging side is sharper. Maine has the country's highest median age at 45 and the largest share of residents 65 and older, per the SmartAsset analysis; New Hampshire and Vermont follow at a median age of 44. Young residents leave rural New England for bigger job markets while retirees move in, which the analysis notes could shrink those states' labor forces if the trends continue. Vermont faces the double case: shrinking and aging at once.
The softer side is affordability. Slower growth eases pressure on housing and infrastructure in expensive markets where supply is scarce. Vermont's median home price actually fell 2 percent year over year in June. There is also a political dimension the numbers imply without confirming: states that grow faster gain relative weight in the House after the next apportionment, and California's slow shrinkage keeps alive the question of whether Texas eventually passes it as the most populous state. What the data establishes is the trajectory; what remains unknown is whether high-growth states can build housing and water systems fast enough to keep absorbing it.
For a related look at how state-level costs diverge, see our explainer on why gas prices vary so much by state — the same cost geography shows up in nearly every relocation decision. We covered a connected angle in Why Do Gas Prices Vary by State: Why Gas Prices Vary So Much by State.